
Reviewing weekly social media numbers to figure out which post types missed the mark so we can plan next week's content.
By the time you export analytics from three different platforms, clean up the spreadsheets, and sort the posts by format, you have spent hours just gathering data instead of looking at why certain formats failed.
- Before
- 90 min
- After
- 35 min
- Saved
- 55 min
How this used to go
- Log into each social media dashboard and export the past week's post data as CSV files.
- Open a master spreadsheet and paste all the metrics together into one sheet.
- Manually categorize every post by format type such as text, image, carousel, or video.
- Calculate the engagement rate for each post using basic spreadsheet formulas.
- Group the posts by format to find the average performance for each category.
- Compare this week's averages against historical data to spot which formats dropped.
Copy-pasting exports from multiple dashboards and manually sorting posts into format categories before you can even look at the numbers.
The workflow, step by step
- You
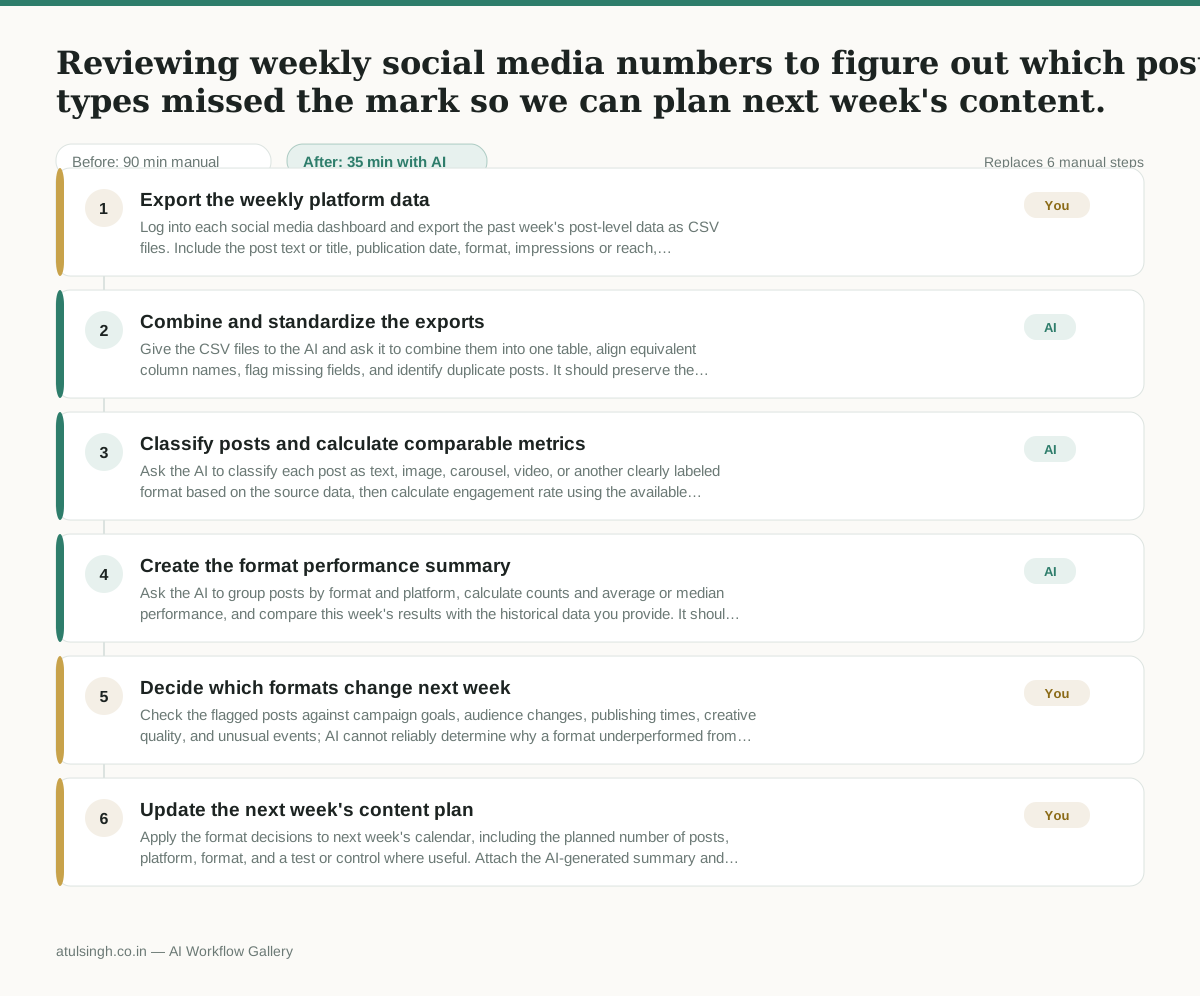
1. Export the weekly platform data
Log into each social media dashboard and export the past week's post-level data as CSV files. Include the post text or title, publication date, format, impressions or reach, reactions, comments, shares, clicks, and any other available engagement metrics.
- AI
2. Combine and standardize the exports
Give the CSV files to the AI and ask it to combine them into one table, align equivalent column names, flag missing fields, and identify duplicate posts. It should preserve the platform and post identifiers so results can be traced back to the source files.
- AI
3. Classify posts and calculate comparable metrics
Ask the AI to classify each post as text, image, carousel, video, or another clearly labeled format based on the source data, then calculate engagement rate using the available denominator. Require it to mark uncertain classifications and metrics that cannot be compared across platforms rather than guessing.
- AI
4. Create the format performance summary
Ask the AI to group posts by format and platform, calculate counts and average or median performance, and compare this week's results with the historical data you provide. It should produce a ranked table of formats that declined, improved, or had too little data for a reliable comparison.
- You
5. Decide which formats change next week
Check the flagged posts against campaign goals, audience changes, publishing times, creative quality, and unusual events; AI cannot reliably determine why a format underperformed from metrics alone. Decide which format to reduce, keep testing, or increase next week, and record the reason and expected consequence for the content plan.
- You
6. Update the next week's content plan
Apply the format decisions to next week's calendar, including the planned number of posts, platform, format, and a test or control where useful. Attach the AI-generated summary and your decisions so the next review can compare the outcome with this week's baseline.
What you end up with
Where this falls apart
- Platform CSV exports use completely different naming conventions for core metrics, causing the AI to misalign columns and calculate false engagement rates.
- A post uses multiple media types in a way not captured by the primary format column, causing the AI to misclassify the post category and skew format averages.
More for Social Media Manager
- Analyze competitor viral posts to draft three trend hooks, discarding off-brand angles
- pitching influencers and checking their engagement before sending messages
- Plan next month's organic social media posts and cut the weak ideas before anyone approves the schedule.
- building next month's social calendar from the content roadmap
Also in marketing
- Turn a recorded customer interview into a draft blog post
- Sorting incoming customer leads from web forms and assigning them to the right sales reps based on company size and location
- Turn a technical whitepaper into a three-part email nurture sequence before it launches
- Reviewing an existing ranking article, checking every claim and figure against current source data, and identifying outdated statements before republication