
compile monthly channel performance reports and flag missed KPIs for the leadership review
pulling data from multiple ad platforms and analytics dashboards takes hours of tedious copy-pasting, and it is easy to miss a declining trend or a missed target until someone in leadership points it out during the meeting.
- Before
- 120 min
- After
- 45 min
- Saved
- 75 min
How this used to go
- Export CSV reports from Google Analytics, Meta Ads, LinkedIn Ads, and the email marketing platform.
- Open a master spreadsheet and copy each channel's spend, leads, and conversion metrics into separate tabs.
- Calculate month-over-month growth rates and compare actual results against the monthly targets.
- Highlight any metrics that missed their goals in red.
- Draft a summary document explaining the variances and paste in screenshots of the charts.
spending an entire morning moving numbers between spreadsheets and formatting charts instead of analyzing why a specific campaign underperformed.
The workflow, step by step
- You
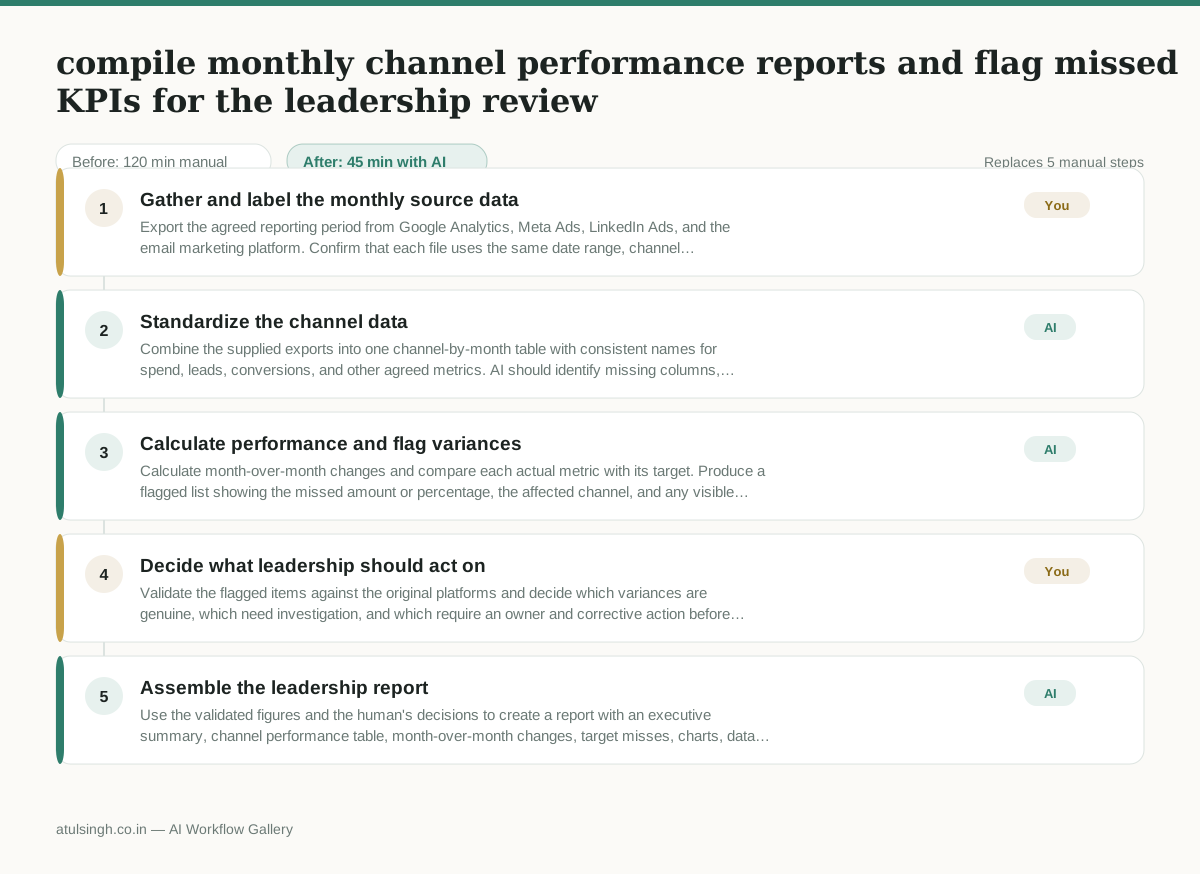
1. Gather and label the monthly source data
Export the agreed reporting period from Google Analytics, Meta Ads, LinkedIn Ads, and the email marketing platform. Confirm that each file uses the same date range, channel definitions, attribution rules, and KPI targets before giving the files and target list to AI.
- AI
2. Standardize the channel data
Combine the supplied exports into one channel-by-month table with consistent names for spend, leads, conversions, and other agreed metrics. AI should identify missing columns, duplicate rows, or incompatible definitions rather than silently filling or guessing values.
- AI
3. Calculate performance and flag variances
Calculate month-over-month changes and compare each actual metric with its target. Produce a flagged list showing the missed amount or percentage, the affected channel, and any visible declining trend; the calculations still depend on accurate source data and targets.
- You
4. Decide what leadership should act on
Validate the flagged items against the original platforms and decide which variances are genuine, which need investigation, and which require an owner and corrective action before the leadership review. Remove or relabel any flag caused by tracking changes, incomplete data, or a target definition that does not apply.
- AI
5. Assemble the leadership report
Use the validated figures and the human's decisions to create a report with an executive summary, channel performance table, month-over-month changes, target misses, charts, data caveats, owners, and proposed next actions. Human-owned decisions and unresolved data issues should be clearly labeled rather than presented as AI conclusions.
What you end up with
Where this falls apart
- Different ad platforms use conflicting attribution models or date definitions, causing the AI to combine incomparable metrics and generate false variance flags.
- A marketing channel undergoes a tracking implementation change mid-month, causing the AI to flag normal tracking gaps as catastrophic performance drops.
More for Marketing Manager
- Write a campaign brief that the agency and the internal design team can both use without contradictory instructions
- Check every lead capture form on the website to make sure submissions reach the right sales reps before launching a new advertising campaign.
- Checking multiple promotional calendars across email, social, and paid ads to make sure campaigns do not overlap or contradict each other before the holiday sales push.
- Reviewing external market research reports and flagging unverified claims before presenting findings to the board.
Also in marketing
- Turn a recorded customer interview into a draft blog post
- Sorting incoming customer leads from web forms and assigning them to the right sales reps based on company size and location
- Turn a technical whitepaper into a three-part email nurture sequence before it launches
- Analyze competitor viral posts to draft three trend hooks, discarding off-brand angles