
Pulling the weekly paid channel report and explaining what actually drove the performance changes
Manually exporting data from multiple ad platforms into a spreadsheet, calculating blended metrics, and trying to figure out why CPA or ROAS fluctuated without getting lost in vanity metrics.
- Before
- 90 min
- After
- 35 min
- Saved
- 55 min
How this used to go
- Export CSV performance data from Meta Ads, Google Ads, and LinkedIn Ads managers.
- Open a master reporting spreadsheet and copy-pasted the raw data into separate tabs.
- Run VLOOKUPs or formulas to combine spend, impressions, clicks, conversions, and revenue by channel.
- Calculate week-over-week percentage changes for cost-per-acquisition, click-through rate, and return on ad spend.
- Review individual campaign and ad set performance to identify outliers or anomalies.
- Draft a summary paragraph explaining which channel caused the overall budget variance.
Spending the first hour just cleaning and aligning mismatched column headers across different ad platform exports before any actual analysis can begin.
The workflow, step by step
- You
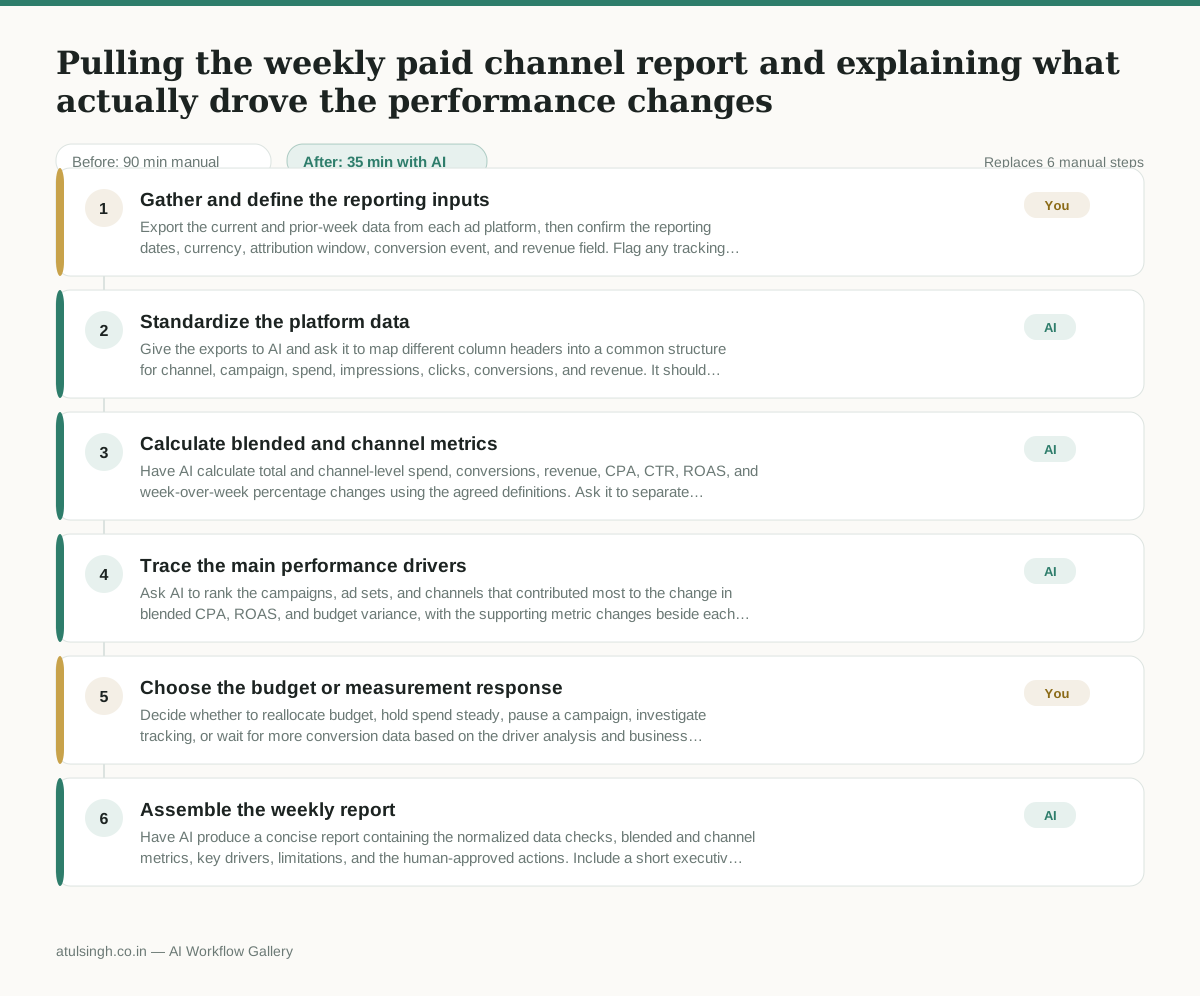
1. Gather and define the reporting inputs
Export the current and prior-week data from each ad platform, then confirm the reporting dates, currency, attribution window, conversion event, and revenue field. Flag any tracking changes, missing days, or platform outages before analysis begins.
- AI
2. Standardize the platform data
Give the exports to AI and ask it to map different column headers into a common structure for channel, campaign, spend, impressions, clicks, conversions, and revenue. It should identify missing fields, duplicate rows, currency mismatches, and records it could not confidently align instead of silently filling them.
- AI
3. Calculate blended and channel metrics
Have AI calculate total and channel-level spend, conversions, revenue, CPA, CTR, ROAS, and week-over-week percentage changes using the agreed definitions. Ask it to separate meaningful changes in spend, conversion volume, revenue, and efficiency from metrics with too little volume to interpret reliably.
- AI
4. Trace the main performance drivers
Ask AI to rank the campaigns, ad sets, and channels that contributed most to the change in blended CPA, ROAS, and budget variance, with the supporting metric changes beside each finding. AI can identify correlations and anomalies, but it cannot reliably prove causation when attribution, tracking, auction conditions, or conversion lag may have changed.
- You
5. Choose the budget or measurement response
Decide whether to reallocate budget, hold spend steady, pause a campaign, investigate tracking, or wait for more conversion data based on the driver analysis and business priorities. Record the decision, the affected campaigns, the expected consequence, and any follow-up owner; do not make a budget change solely because of a small week-over-week percentage swing.
- AI
6. Assemble the weekly report
Have AI produce a concise report containing the normalized data checks, blended and channel metrics, key drivers, limitations, and the human-approved actions. Include a short executive summary that distinguishes observed changes from hypotheses and clearly labels unresolved data issues.
What you end up with
Where this falls apart
- The ad platform exports use different currency symbols, date formats, or conflicting conversion tracking definitions that cannot be automatically reconciled, causing the AI to miscalculate blended metrics and week-over-week changes.
- Low-volume campaigns experience minor raw numeric fluctuations that the AI misinterprets as significant efficiency swings, leading to false performance driver rankings.
More for Performance Marketer
- Write and test five ad variants for one campaign from a single landing page
- Figure out why ad spend suddenly stopped working and cost per lead doubled over the last week.
- Write and test five ad variants for a campaign, pausing underperformers after launch
- build the weekly paid channel report, flagging anomalous cost spikes before Monday sync
Also in marketing
- Turn a recorded customer interview into a draft blog post
- Sorting incoming customer leads from web forms and assigning them to the right sales reps based on company size and location
- Turn a technical whitepaper into a three-part email nurture sequence before it launches
- Analyze competitor viral posts to draft three trend hooks, discarding off-brand angles