
Figure out why ad spend suddenly stopped working and cost per lead doubled over the last week.
Performance marketers waste hours pulling data across multiple ad platforms and analytics dashboards, trying to manually cross-reference campaign changes, audience saturation, and landing page metrics to find the root cause of a sudden cost spike.
- Before
- 60 min
- After
- 35 min
- Saved
- 25 min
How this used to go
- Export the last 7 days and previous 7 days of performance data from the ad platform into a spreadsheet.
- Break down the data by campaign, ad set, creative, and audience to isolate where costs increased.
- Check the website analytics platform to see if conversion rates dropped on specific landing pages.
- Review historical change logs in the ad manager to see what edits were made right before performance dropped.
- Compare audience frequency metrics and impression delivery to check for creative fatigue or audience saturation.
Cross-referencing spreadsheets of ad performance with website conversion data and change logs to find the single root cause is tedious and prone to missing subtle shifts.
The workflow, step by step
- You
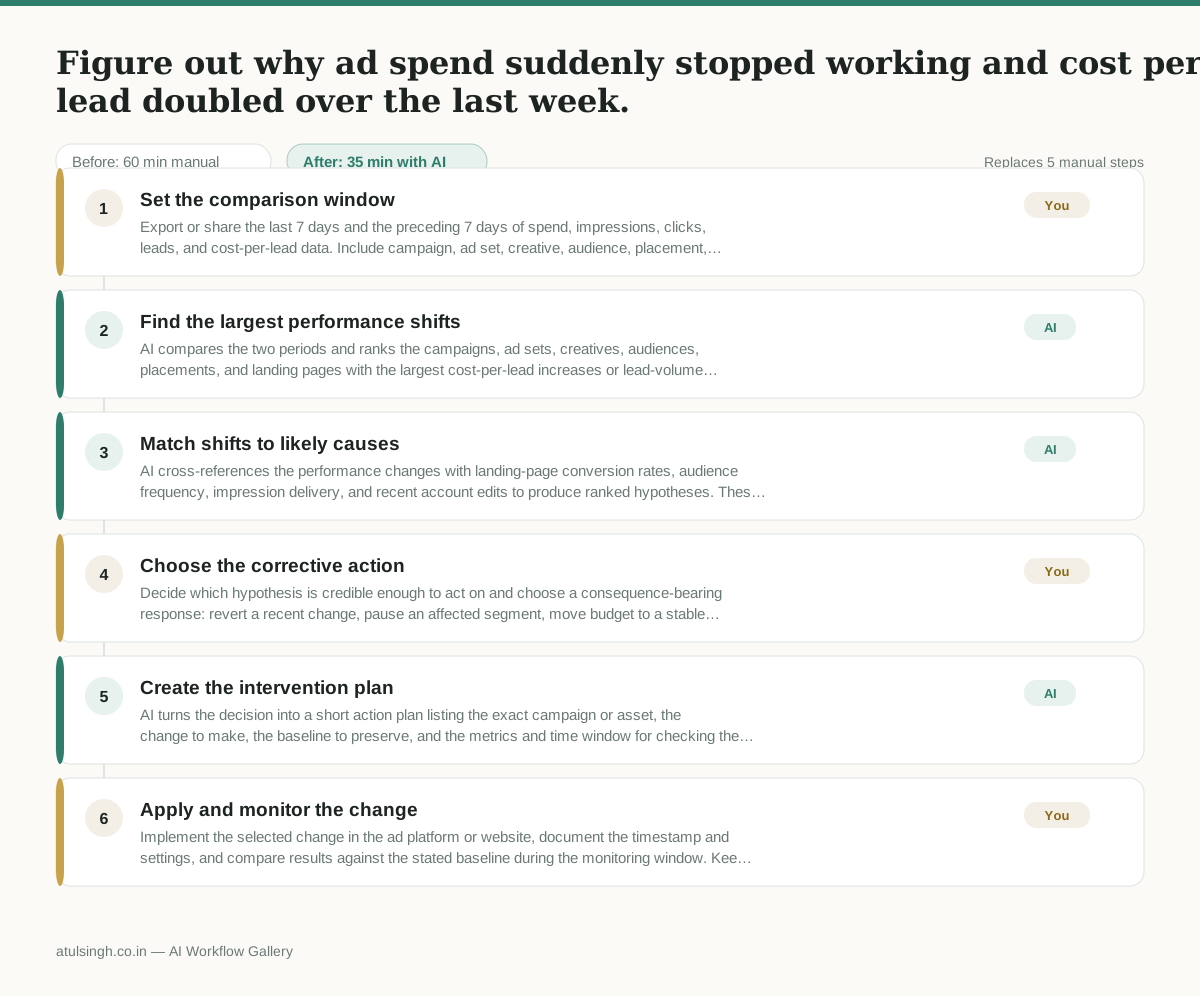
1. Set the comparison window
Export or share the last 7 days and the preceding 7 days of spend, impressions, clicks, leads, and cost-per-lead data. Include campaign, ad set, creative, audience, placement, landing page, and change-log fields where available.
- AI
2. Find the largest performance shifts
AI compares the two periods and ranks the campaigns, ad sets, creatives, audiences, placements, and landing pages with the largest cost-per-lead increases or lead-volume losses. It should flag missing, inconsistent, or insufficient data instead of treating gaps as evidence.
- AI
3. Match shifts to likely causes
AI cross-references the performance changes with landing-page conversion rates, audience frequency, impression delivery, and recent account edits to produce ranked hypotheses. These are diagnostic leads, not proof of causation, because platform attribution and limited time windows can obscure the true cause.
- You
4. Choose the corrective action
Decide which hypothesis is credible enough to act on and choose a consequence-bearing response: revert a recent change, pause an affected segment, move budget to a stable segment, replace fatigued creative, or fix the landing page. Reject any proposed action that cannot be supported by the available data or that would create unacceptable delivery risk.
- AI
5. Create the intervention plan
AI turns the decision into a short action plan listing the exact campaign or asset, the change to make, the baseline to preserve, and the metrics and time window for checking the result. It also records alternative explanations that should be investigated if performance does not recover.
- You
6. Apply and monitor the change
Implement the selected change in the ad platform or website, document the timestamp and settings, and compare results against the stated baseline during the monitoring window. Keep the original setup available for comparison; AI cannot reliably confirm the root cause from historical data alone.
What you end up with
Where this falls apart
- The ad platform export contains attribution window changes or tracking cookie disruptions, which causes the AI to misinterpret platform tracking errors as sudden creative fatigue or landing page failures.
- Recent offline conversion uploads or CRM sync delays occur during the 7-day comparison window, which causes the model to generate incorrect cost-per-lead hypotheses based on incomplete lead volume data.
More for Performance Marketer
- Write and test five ad variants for one campaign from a single landing page
- Pulling the weekly paid channel report and explaining what actually drove the performance changes
- Write and test five ad variants for a campaign, pausing underperformers after launch
- build the weekly paid channel report, flagging anomalous cost spikes before Monday sync
Also in marketing
- Turn a recorded customer interview into a draft blog post
- Sorting incoming customer leads from web forms and assigning them to the right sales reps based on company size and location
- Turn a technical whitepaper into a three-part email nurture sequence before it launches
- Analyze competitor viral posts to draft three trend hooks, discarding off-brand angles