
Compare multi-touch attribution models against channel performance data to find discrepancies before monthly reporting.
Attribution models often assign credit differently for the same conversion path, and finding these gaps by hand across multiple ad platforms and analytics tools takes hours of spreadsheet work just before leadership reviews the numbers.
- Before
- 180 min
- After
- 60 min
- Saved
- 120 min
How this used to go
- Export conversion and spend data from each paid acquisition channel into separate CSV files.
- Pull attribution reports for first-touch, last-touch, and linear models from the central analytics platform.
- Combine all datasets into a master spreadsheet using VLOOKUP or index-match formulas.
- Calculate variance percentages between channel-reported conversions and multi-touch model allocations.
- Flag channels where discrepancy thresholds exceed normal variance limits for manual review.
- Draft an escalation summary explaining the variance patterns to share with finance or leadership.
Reconciling mismatched campaign naming conventions and date ranges across different platforms before the actual comparison can even begin.
The workflow, step by step
- AI
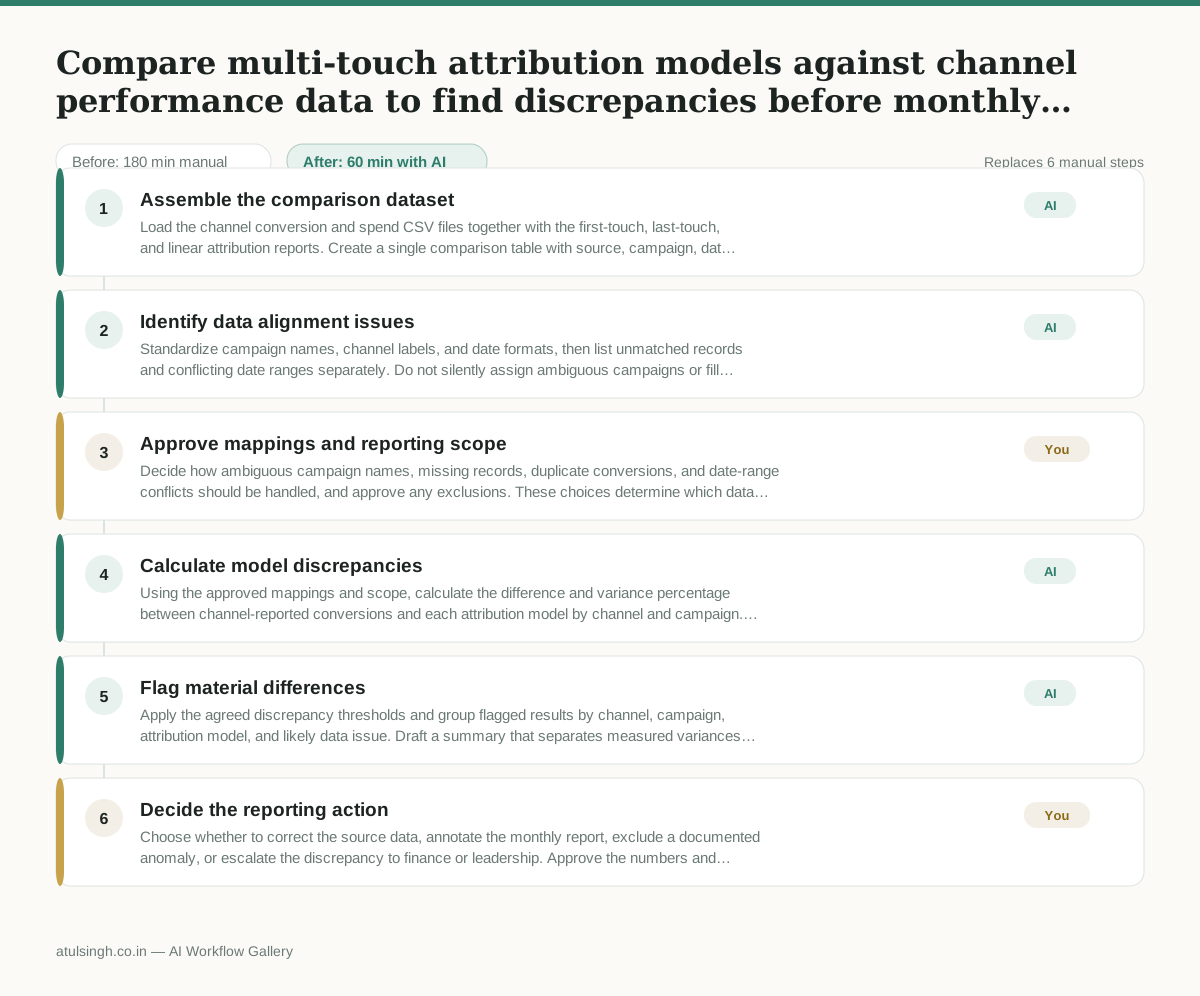
1. Assemble the comparison dataset
Load the channel conversion and spend CSV files together with the first-touch, last-touch, and linear attribution reports. Create a single comparison table with source, campaign, date range, conversions, spend, and attributed conversions.
- AI
2. Identify data alignment issues
Standardize campaign names, channel labels, and date formats, then list unmatched records and conflicting date ranges separately. Do not silently assign ambiguous campaigns or fill missing conversion values.
- You
3. Approve mappings and reporting scope
Decide how ambiguous campaign names, missing records, duplicate conversions, and date-range conflicts should be handled, and approve any exclusions. These choices determine which data is included in the variance analysis and must be recorded with the final report.
- AI
4. Calculate model discrepancies
Using the approved mappings and scope, calculate the difference and variance percentage between channel-reported conversions and each attribution model by channel and campaign. Preserve the underlying values so the calculations can be traced back to their source rows.
- AI
5. Flag material differences
Apply the agreed discrepancy thresholds and group flagged results by channel, campaign, attribution model, and likely data issue. Draft a summary that separates measured variances from possible explanations, since attribution differences alone do not prove tracking errors.
- You
6. Decide the reporting action
Choose whether to correct the source data, annotate the monthly report, exclude a documented anomaly, or escalate the discrepancy to finance or leadership. Approve the numbers and explanation that will be used in monthly reporting.
What you end up with
Where this falls apart
- Campaign naming conventions across paid channels change frequently without standardized prefixes, causing the model to misalign performance data and output incorrect variance calculations.
- Raw data exports from ad platforms and analytics tools contain overlapping date ranges or missing tracking parameters, producing false discrepancy flags that distort the monthly report.
More for Performance Marketer
- Write and test five ad variants for one campaign from a single landing page
- Pulling the weekly paid channel report and explaining what actually drove the performance changes
- Figure out why ad spend suddenly stopped working and cost per lead doubled over the last week.
- Write and test five ad variants for a campaign, pausing underperformers after launch
Also in marketing
- Turn a recorded customer interview into a draft blog post
- Sorting incoming customer leads from web forms and assigning them to the right sales reps based on company size and location
- Turn a technical whitepaper into a three-part email nurture sequence before it launches
- Analyze competitor viral posts to draft three trend hooks, discarding off-brand angles